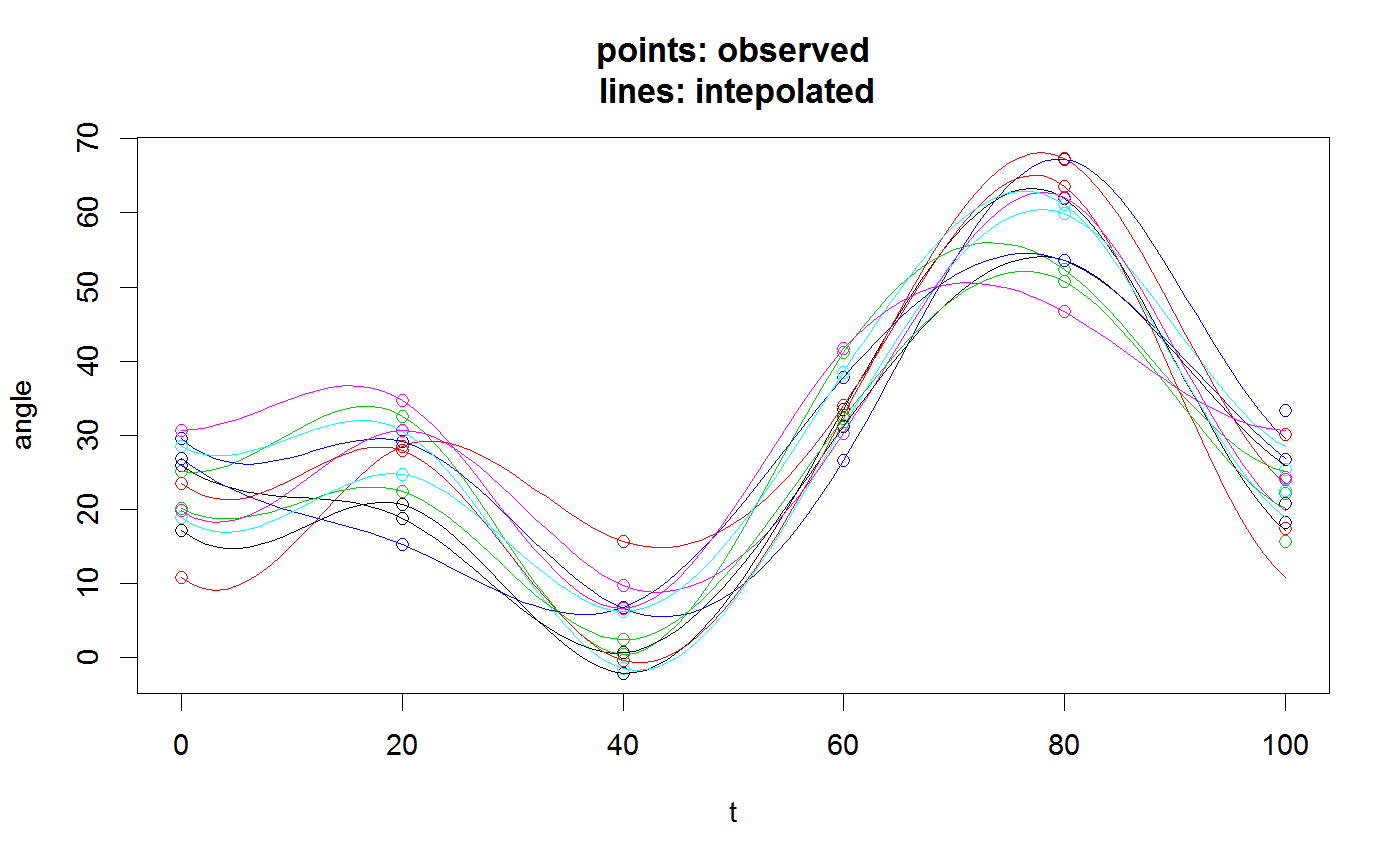
Resample curves to t=0,...,100 using splines.
Resample curves to t=0,...,100 using splines.
resamp101(x, ..., plot = FALSE)
Arguments
| x | data.frame with kinematics data in the wide format. |
|---|---|
| ... | column names (bare) of the kinematics data. It should be specified select style. |
| plot | logical. If |
Value
same as x but ... replaced by columns 0,1,...,100.
Details
The resampling (intepolation) is done using periodic cubic spline. In particular, splinefun is the workhorse function.
Examples
X=kinematics%>%
filter(joint=="Knee",plane=="sag")%>%
  select(curve_id,`0`,`20`,`40`,`60`,`80`,`100`)
z=resamp101(X,`0`:`100`,plot=T)